After a mildly strenuous, 8-day trek from Bavaria to Italy, it is desirably to take stock of one’s accomplishments by creating an altitude profile of the trip. If does not possess a GPS track of the trip, the coordinates can be extracted using one’s excellent knowledge of the terrain and the sometimes frighteningly detailed imagery in Google Earth. Most of the time, one can actually see the footpath and trace it out without a lot of guesswork. This is less true when tracing a path over boulder fields and glaciers, but these tend to be in the minority, I hope.
(Aside: why, oh why does Yahoo Maps use pictures taken at sunrise in the dead of winter for its detail images of the Austrian Alps? Useless! This wouldn’t be a problem if it weren’t for the fact that Flickr uses Yahoo Maps for its geotagging interface. I want a D90 with a GPS logger. Now.)
So, on to the procedure. First, create a new path that traces your route. Save it as a KML file, and examine the resulting file. The path itself is contained in the <coordinates> tag as a series of coordinates longitude,latitude,altitude (e.g. 11.26463484323443,47.3865106283369,0). The most obvious thing to notice is that the “altitude” as always 0. Google Earth simply does not store elevation data in KML files. This is eminently fixable, as elevation data for the more densely populated areas of the world exist and are freely available, thanks to the Shuttle Radar Topography Mission. The SRTM data give us an elevation for land areas between 60 degrees north and 56 degrees south on a grid of about 3 arc seconds (90 m). Instead downloading and parsing the data ourselves, we can query the copy hosted at GeoNames. The resulting altitudes can be inserted into the KML file, giving us complete data to work with. The idea came from the KML Altitude Filler, but it’s simple enough (and faster, really) to do it yourself. In Ruby, it would look something like this:
#!/usr/bin/env ruby
#
#  kml_altitude.rb
#  Add altitude data to coordinates in Google Earth files.
#
#  Created by Jakob van Santen on 2008-09-04.
#
require 'rubygems'
require 'hpricot'
require 'open-uri'

webservice = "http://ws.geonames.org/srtm3?lat=%s&lng=%s"
default_alt = "0"
null_alt = "-32768"

# magic fluff to deal with missing altitude points (happens occasionally in narrow passes and such)

def max(a,b)
  case a<=>b
    when -1 then b
    when 0 then a
    when 1 then b
  end
end

def search_for_valid_alt(arr,start_index)
  null_alt = "-32768"
  offset = 0
  hit = nil
  puts "searching for valid altitude around #{start_index}"
  while offset < max(start_index,arr.size-start_index)
    if arr[start_index-offset][2] != null_alt then
      hit = arr[start_index-offset][2]
      puts "valid alt #{hit} at #{start_index-offset}"
      break
    elsif arr[start_index+offset][2] != null_alt then
      hit = arr[start_index+offset][2]
      puts "valid alt #{hit} at #{start_index+offset}"
      break
    else
      offset += 1
      puts "offset=#{offset}"
    end
  end
  hit
end

fname = File.expand_path(ARGV[0])

kml = Hpricot.XML(open(fname))

coords = (kml/"coordinates")

coords.each do |single_coord|
  coord_arr = single_coord.inner_html.split(" ").collect {|c| c.split(",")}
  puts "Finding altitudes for #{coord_arr.size} points"
  coord_arr.collect! do |long,lat,alt|
    next unless alt == default_alt
    begin
    alt = open(webservice % [lat,long]) {|f| f.read}.chomp
    rescue Timeout::Error
      puts "timed out"
      retry
    end
    p [long,lat,alt]
    [long,lat,alt]
  end
  # deal with voids in the STRM3 data
  if coord_arr.detect {|d| d[2] == null_alt} then
    coord_arr.each_with_index do |coord,i|
      next if coord[2] != null_alt
      coord_arr[i][2] = search_for_valid_alt(coord_arr,i)
    end
  end
  # stick the modified coordinates back into the  element
  single_coord.inner_html = coord_arr.collect {|c| c.join(",")}.join(" ")
end

new_fname = fname.sub(/(.\w{3})$/,'-filled\1')
File.open(new_fname,'w') {|f| f.write(kml)}
puts "Wrote altitude data to #{new_fname}"
This script inserts altitudes in every <coordinates> element it finds in the KML file. Even after cleaning, there are still some voids in the SRTM3 data, which are returned as -32768. I only saw this happen once; the coordinates were in a fairly narrow pass. The search_for_valid_alt() method simply searches backward and forward along the path until it finds a valid altitude.
So, now we have an exact specification of each point on the globe. Now, we can simply calculate the distance between two points and plot it against the elevation. As it turns out, this is slightly more concise in Python (after figuring out how the heck PyXML works, that is):
#
#  kml_profile.py
#  Create an altitude profile based on the coordinates in a Google Earth KML file
#  The file must contain one or more paths (in the proper order)
#
#  Created by Jakob van Santen on 2008-09-05.
#
import sys, os.path
import xml.dom.minidom
from numpy import *
from pylab import *
import scipy.interpolate

def cartesian(geocoords):
    long,lat,alt = geocoords
    r = alt + 6378135.0
    theta = pi*(90-long)/180.0
    phi = pi*lat/180.0
    return [r*sin(theta)*cos(phi),r*sin(theta)*sin(phi),r*cos(theta)]

def distance(coord1,coord2):
    return sqrt(sum((array(cartesian(coord1))-array(cartesian(coord2)))**2))

def profile(coords):
    ctext = coords.firstChild.wholeText
    coord_arr = [[float(f) for f in el.split(",")] for el in ctext.split()]
    d = [distance(c,coord_arr[i]) for i,c in enumerate(coord_arr[1:len(coord_arr)])]
    linear = [0]
    def adder(x,y):
        # print x,y
        linear.append(x+y)
        return x+y

    reduce(adder, d, 0)

    z = [c[2] for c in coord_arr]

    # calculate the elevation gain using a smooth spline
    tck = scipy.interpolate.splrep(linear,z,s=3e2*len(linear))
    smoothz = scipy.interpolate.splev(linear,tck)
    up = 0
    down = 0
    for i,alt in enumerate(smoothz[1:len(smoothz)]):
        diff = alt-smoothz[i]
        if diff<0:
            down -= diff
        else:
            up += diff

    return [linear,z,smoothz,up,down]

def flatten_1(list):
    out = list[0]
    for el in list[1:]:
        out = concatenate((out,el),axis=1)
    return out

fname = sys.argv[1]
kml = xml.dom.minidom.parse(fname)
coords = kml.getElementsByTagName("coordinates")
# create an elevation profile for each  block
results = map(profile,coords)

# concatenate altitude arrays for each path
z = flatten_1([res[1] for res in results])
smoothz = flatten_1([res[2] for res in results])
up = sum([res[3] for res in results])
down = sum([res[4] for res in results])
# create a linear distance scale for the combined path (each individual path starts from 0)
unadjusted_linear = [0].extend([res[0] for res in results])
linear = results[0][0]
for subaxis in [res[0] for res in results[1:]]:
    shifted = [el+linear[-1] for el in subaxis]
    linear.extend(shifted)

# plot it
plot(array(linear)/1000.0,z)
# plot(array(linear)/1000.0,smoothz)
grid()
title("Elevation profile for %s" % os.path.split(fname)[1])
xlabel('linear km')
ylabel('m above sea level')
figtext(0.15,0.75,'km: %.2f\nm up: %d\nm down:%d' % (linear[-1]/1000.0,int(up),int(down)))
show()
There are a lot of scipy/matplotlib/numpy dependencies in here, but that’s what I happen to have lying around. The meat of the script is in the profile() method, which takes a <coordinates> DOM element. It takes each coordinate pair, converts it from equatorial spherical coordinates (in degrees) to polar spherical coordinates (in radians), then to cartesian coordinates (about the center of the earth), then calculates the distance between the two points in meters. It then adds up the distances to create a linear distance scale and extracts the elevation from each point into a separate array. Voila, an elevation profile!
As an added bonus, it also calculates the elevation gain and loss over a path, using a cubic spline instead of the actual data points. When the path is traced exactly (e.g. including every curve and switchback), the elevation tends to fluctuate wildly by a few meters, resulting in up to a kilometer of “extra” elevation gain and loss over the course of a day.
The other bits of the script just handle concatenation multiple paths, as I had my trek split up by days. Finally, we plot the final product, which will look something like this (if, for example, you hike from Mittenwald (Bavaria) to Luttach (South Tirol) via Wattens (Tirol)):
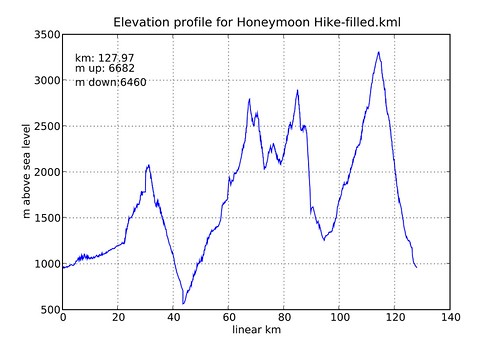
Enjoy!